
Which is the best city for Gamers in 2017?
Gaming is taking very serious as to call it a hobby is an understatement. Gaming is big business as the industry spends over $100 billion globally a year. vs. in 2016 movie ticket sales were $62.5 billion.
Gaming is not for children as close 50% of U.S. adults play video games, and two out three households have at least on “gamer” who plays three to four hours a week.
| Top 20 Cities for Gamers | ||||
| 1 | Orlando, FL | 11 | San Francisco, CA | |
| 2 | Seattle, WA | 12 | San Jose, CA | |
| 3 | Austin, TX | 13 | Fremont, CA | |
| 4 | New York, NY | 14 | Pittsburgh, PA | |
| 5 | Atlanta, GA | 15 | Columbus, OH | |
| 6 | Los Angeles, CA | 16 | Raleigh, NC | |
| 7 | Las Vegas, NV | 17 | Anaheim, CA | |
| 8 | Irvine, CA | 18 | Virginia Beach, VA | |
| 9 | Boston, MA | 19 | Madison, WI | |
| 10 | San Diego, CA | 20 | Portland, OR | |
Best vs. Worst
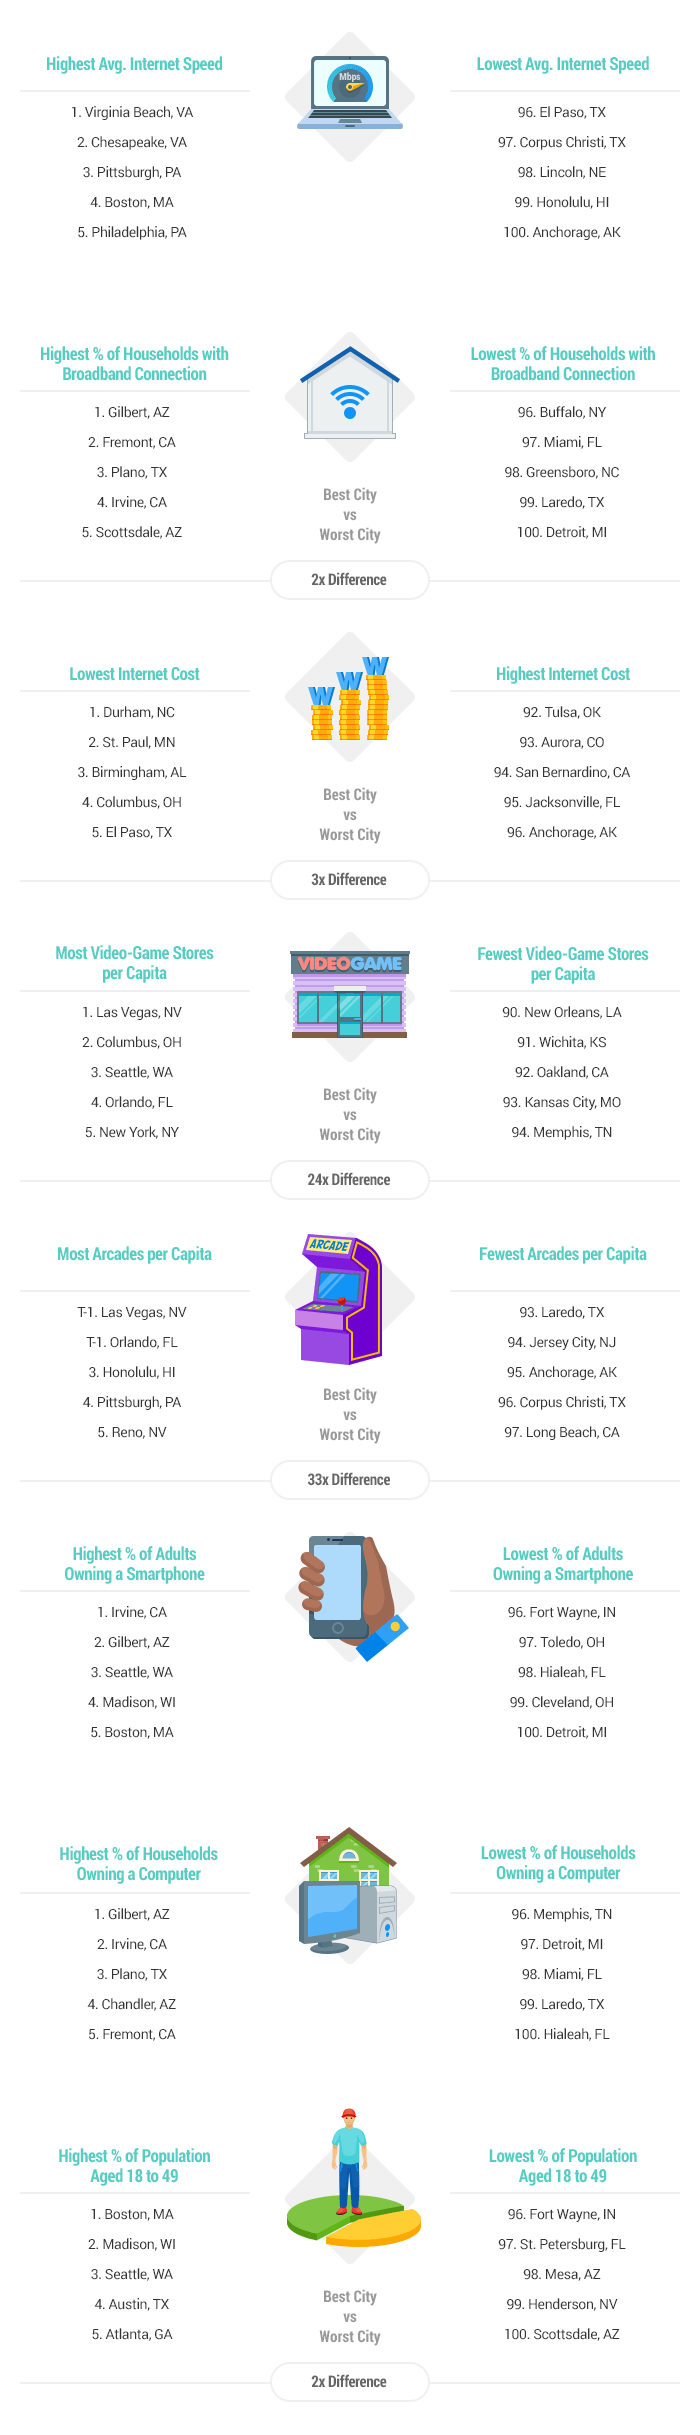
- Las Vegas has the most video-game stores per square root of the population, 0.0283, which is 23.6 times more than in Memphis, Tenn., the city with the fewest at 0.0012.
- Pittsburgh has the highest average download speed, 14.62 Mbps, which is 3.1 times higher than in Honolulu, the city with the lowest at 4.70 Mbps.
- Gilbert, Ariz., has the highest share of households with a broadband connection, 94 percent, which is 1.9 times higher than in Detroit, the city with the lowest at 50 percent.
- Durham, N.C., has the cheapest monthly internet cost, $40, which is 2.5 times cheaper than in Anchorage, Alaska, the city with the most expensive at $101.36.
Check out which are the best cities for gamers in 2017 via interactive map and Infographic.
Click your city to where it ranks:
Top 100 Cities for Gamers:
Best Cities for Gamers
| Overall Rank (1=Best) |
City | Total Score | ‘Gaming Environment’ Rank | ‘Internet Quality & Coverage’ Rank | ‘Gamer & Developer Opportunities’ Rank |
|---|---|---|---|---|---|
| 1 | Orlando, FL | 65.51 | 1 | 53 | 2 |
| 2 | Seattle, WA | 62.76 | 2 | 24 | 5 |
| 3 | Austin, TX | 59.47 | 6 | 44 | 3 |
| 4 | New York, NY | 59.05 | 5 | 29 | 4 |
| 5 | Atlanta, GA | 57.09 | 3 | 48 | 8 |
| 6 | Los Angeles, CA | 55.74 | 11 | 62 | 1 |
| 7 | Las Vegas, NV | 55.34 | 4 | 39 | 12 |
| 8 | Irvine, CA | 53.93 | 12 | 9 | 11 |
| 9 | Boston, MA | 51.95 | 13 | 13 | 10 |
| 10 | San Diego, CA | 50.04 | 15 | 26 | 7 |
| 11 | San Francisco, CA | 48.23 | 29 | 17 | 6 |
| 12 | San Jose, CA | 46.57 | 24 | 7 | 15 |
| 13 | Fremont, CA | 46.37 | 14 | 4 | 45 |
| 14 | Pittsburgh, PA | 46.15 | 25 | 11 | 13 |
| 15 | Columbus, OH | 46.12 | 7 | 35 | 41 |
| 16 | Raleigh, NC | 45.85 | 9 | 33 | 26 |
| 17 | Anaheim, CA | 44.26 | 8 | 37 | 88 |
| 18 | Virginia Beach, VA | 43.36 | 46 | 1 | 72 |
| 19 | Madison, WI | 42.83 | 21 | 27 | 22 |
| 20 | Portland, OR | 42.65 | 17 | 31 | 18 |
| 21 | Chandler, AZ | 42.15 | 42 | 3 | 55 |
| 22 | Plano, TX | 42.14 | 31 | 8 | 37 |
| 23 | Jersey City, NJ | 42.01 | 37 | 12 | 90 |
| 24 | Scottsdale, AZ | 41.78 | 34 | 6 | 47 |
| 25 | Tampa, FL | 41.77 | 16 | 30 | 39 |
| 26 | Denver, CO | 41.21 | 19 | 47 | 16 |
| 27 | Sacramento, CA | 40.89 | 28 | 22 | 24 |
| 28 | Dallas, TX | 40.31 | 10 | 92 | 19 |
| 29 | Minneapolis, MN | 40.14 | 23 | 34 | 23 |
| 30 | Chesapeake, VA | 39.82 | 79 | 2 | 79 |
| 31 | Chicago, IL | 39.43 | 41 | 71 | 9 |
| 32 | Gilbert, AZ | 39.06 | 43 | 5 | 86 |
| 33 | Durham, NC | 38.90 | 44 | 16 | 35 |
| 34 | Charlotte, NC | 38.21 | 33 | 28 | 30 |
| 35 | Washington, DC | 38.12 | 18 | 54 | 31 |
| 36 | Riverside, CA | 37.70 | 60 | 10 | 65 |
| 37 | Reno, NV | 37.26 | 47 | 18 | 33 |
| 38 | Nashville, TN | 36.06 | 30 | 43 | 46 |
| 39 | Houston, TX | 35.79 | 22 | 84 | 21 |
| 40 | St. Paul, MN | 35.50 | 52 | 21 | 43 |
| 41 | Henderson, NV | 35.23 | 72 | 14 | 36 |
| 42 | Baltimore, MD | 35.18 | 49 | 58 | 17 |
| 43 | Garland, TX | 35.04 | 69 | 20 | 90 |
| 44 | Norfolk, VA | 34.91 | 71 | 15 | 57 |
| 45 | Irving, TX | 34.78 | 32 | 38 | 77 |
| 46 | San Antonio, TX | 34.64 | 27 | 83 | 27 |
| 47 | Philadelphia, PA | 34.14 | 83 | 42 | 14 |
| 48 | Oakland, CA | 34.10 | 64 | 51 | 20 |
| 49 | Baton Rouge, LA | 34.05 | 35 | 60 | 42 |
| 50 | Cincinnati, OH | 34.01 | 36 | 67 | 48 |
| 51 | Fort Worth, TX | 33.65 | 26 | 80 | 66 |
| 52 | Phoenix, AZ | 33.65 | 45 | 56 | 29 |
| 53 | Miami, FL | 33.57 | 20 | 95 | 32 |
| 54 | Santa Ana, CA | 33.31 | 51 | 61 | 25 |
| 55 | Long Beach, CA | 33.25 | 68 | 19 | 60 |
| 56 | Indianapolis, IN | 33.10 | 39 | 73 | 28 |
| 57 | Arlington, TX | 32.98 | 65 | 57 | 90 |
| 58 | North Las Vegas, NV | 32.72 | 73 | 25 | 78 |
| 59 | Tucson, AZ | 32.34 | 58 | 46 | 40 |
| 60 | Lexington-Fayette, KY | 31.85 | 66 | 45 | 56 |
| 61 | Birmingham, AL | 31.57 | 54 | 72 | 76 |
| 62 | Mesa, AZ | 31.46 | 76 | 32 | 63 |
| 63 | Boise, ID | 31.46 | 48 | 50 | 70 |
| 64 | Jacksonville, FL | 31.02 | 40 | 77 | 62 |
| 65 | Lubbock, TX | 30.90 | 62 | 68 | 90 |
| 66 | Aurora, CO | 30.77 | 53 | 75 | 52 |
| 67 | Colorado Springs, CO | 30.41 | 67 | 59 | 71 |
| 68 | St. Louis, MO | 30.39 | 50 | 78 | 34 |
| 69 | Omaha, NE | 30.03 | 70 | 52 | 50 |
| 70 | Fort Wayne, IN | 29.53 | 88 | 23 | 87 |
| 71 | Honolulu, HI | 29.37 | 55 | 81 | 61 |
| 72 | Newark, NJ | 29.25 | 63 | 65 | 64 |
| 73 | Fresno, CA | 29.11 | 87 | 36 | 69 |
| 74 | Chula Vista, CA | 29.06 | 75 | 41 | 90 |
| 75 | Albuquerque, NM | 28.93 | 57 | 85 | 51 |
| 76 | Glendale, AZ | 28.81 | 59 | 55 | 84 |
| 77 | Lincoln, NE | 28.78 | 80 | 74 | 73 |
| 78 | Bakersfield, CA | 28.62 | 77 | 64 | 75 |
| 79 | Louisville, KY | 28.42 | 61 | 76 | 54 |
| 80 | Kansas City, MO | 27.99 | 81 | 63 | 80 |
| 81 | Winston-Salem, NC | 27.91 | 85 | 40 | 85 |
| 82 | New Orleans, LA | 27.31 | 38 | 98 | 44 |
| 83 | Anchorage, AK | 26.73 | 56 | 96 | 74 |
| 84 | St. Petersburg, FL | 26.29 | 92 | 49 | 68 |
| 85 | Buffalo, NY | 25.84 | 89 | 66 | 49 |
| 86 | Greensboro, NC | 25.53 | 74 | 97 | 90 |
| 87 | Toledo, OH | 25.40 | 86 | 88 | 82 |
| 88 | Milwaukee, WI | 25.07 | 82 | 87 | 53 |
| 89 | Oklahoma City, OK | 24.87 | 78 | 90 | 67 |
| 90 | Stockton, CA | 24.77 | 95 | 69 | 90 |
| 91 | El Paso, TX | 24.09 | 90 | 79 | 81 |
| 92 | Tulsa, OK | 23.66 | 84 | 94 | 88 |
| 93 | Cleveland, OH | 23.34 | 91 | 93 | 38 |
| 94 | Hialeah, FL | 23.26 | 98 | 70 | 90 |
| 95 | Wichita, KS | 22.29 | 97 | 86 | 90 |
| 96 | San Bernardino, CA | 22.26 | 94 | 82 | 59 |
| 97 | Corpus Christi, TX | 22.16 | 93 | 91 | 90 |
| 98 | Memphis, TN | 20.72 | 96 | 89 | 83 |
| 99 | Laredo, TX | 14.69 | 100 | 99 | 90 |
| 100 | Detroit, MI | 13.19 | 99 | 100 | 58 |
See Infographic for various lists related to gaming:
Whether your into gaming, it’s fascinating to see how many people make it their pastime.
To see original article, click here: https://wallethub.com/edu/best-cities-for-gamers/36270/


