
Staying active and being healthy provides a happy life but also helps you save money. Some cities are more conducive to being active and living a healthy lifestyle, while making it a bit more difficult (relative to other cities).
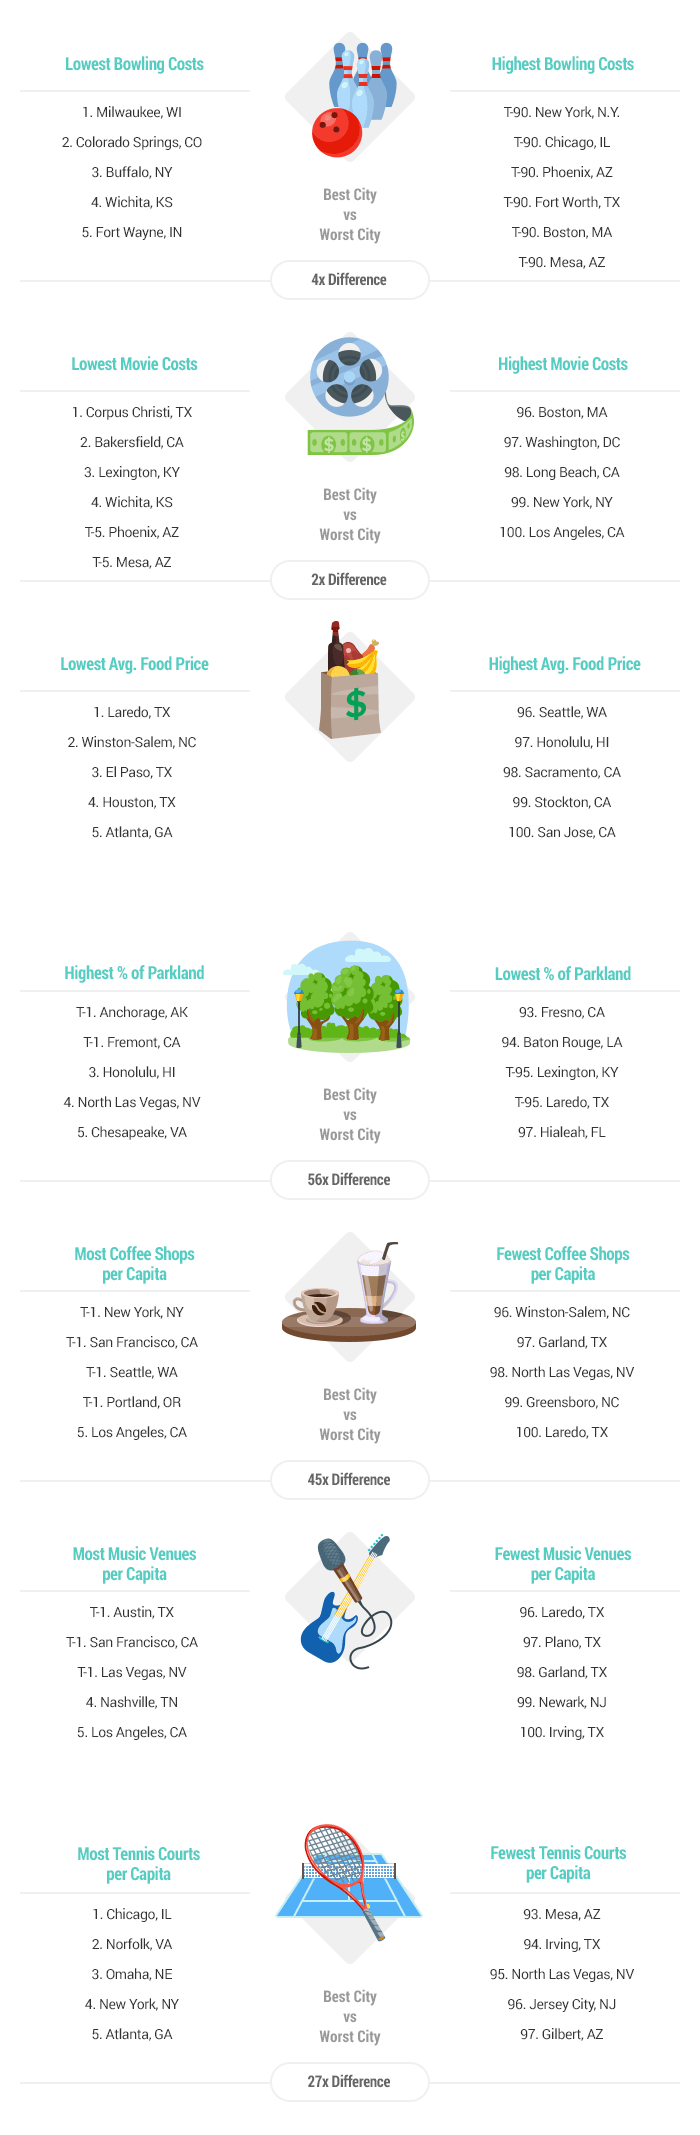
One factor is te number neighborhood parks as they build community, increase property values and can reduce pollution.
There is also a direct correlation between overall health and your wallet. “A regular vigorous run can cut medical costs by an average of $250 a year” per person according to The Trust for Public Land. Understanding these benefits over a hundred large U.S. cities invested more than $7 billion in parks and recreation in 2016 alone.
Check out this interactive chart to see where your city ranks:
Best Cities for Recreation
| Overall Rank (1=Best) |
City | Total Score | ‘Entertainment & Recreational Facilities’ Rank | ‘Costs’ Rank | ‘Quality of Parks’ Rank | ‘Weather’ Rank |
|---|---|---|---|---|---|---|
| 1 | Orlando, FL | 59.10 | 3 | 17 | 41 | 28 |
| 2 | San Diego, CA | 56.68 | 2 | 71 | 15 | 34 |
| 3 | Las Vegas, NV | 55.55 | 9 | 31 | 35 | 18 |
| 4 | Tampa, FL | 52.97 | 17 | 24 | 74 | 13 |
| 5 | Atlanta, GA | 51.63 | 10 | 62 | 24 | 41 |
| 6 | Cincinnati, OH | 51.41 | 18 | 6 | 19 | 58 |
| 7 | Tucson, AZ | 49.68 | 31 | 9 | 66 | 16 |
| 8 | Denver, CO | 49.67 | 12 | 36 | 18 | 64 |
| 9 | San Francisco, CA | 49.46 | 1 | 99 | 11 | 49 |
| 10 | Chicago, IL | 49.12 | 4 | 88 | 3 | 92 |
| 11 | Portland, OR | 49.10 | 8 | 61 | 27 | 78 |
| 12 | Seattle, WA | 49.07 | 6 | 83 | 6 | 70 |
| 13 | Boise, ID | 49.04 | 48 | 2 | 62 | 26 |
| 14 | Honolulu, HI | 48.59 | 11 | 79 | 33 | 43 |
| 15 | Sacramento, CA | 48.55 | 25 | 67 | 31 | 9 |
| 16 | Scottsdale, AZ | 48.37 | 35 | 39 | 67 | 3 |
| 17 | Los Angeles, CA | 47.96 | 13 | 92 | 55 | 7 |
| 18 | New York, NY | 47.79 | 5 | 100 | 1 | 55 |
| 19 | Philadelphia, PA | 47.78 | 15 | 69 | 25 | 52 |
| 20 | Minneapolis, MN | 47.78 | 22 | 26 | 7 | 77 |
| 21 | St. Louis, MO | 47.78 | 23 | 5 | 12 | 94 |
| 22 | New Orleans, LA | 47.11 | 20 | 57 | 13 | 53 |
| 23 | Phoenix, AZ | 46.66 | 43 | 22 | 73 | 17 |
| 24 | St. Petersburg, FL | 46.33 | 33 | 25 | 44 | 40 |
| 25 | El Paso, TX | 46.22 | 83 | 1 | 65 | 25 |
| 26 | Pittsburgh, PA | 46.19 | 24 | 28 | 9 | 84 |
| 27 | Omaha, NE | 45.51 | 36 | 13 | 5 | 75 |
| 28 | Austin, TX | 45.01 | 14 | 43 | 76 | 81 |
| 29 | Lincoln, NE | 44.68 | 45 | 50 | 16 | 46 |
| 30 | Henderson, NV | 44.66 | 72 | 20 | 79 | 4 |
| 31 | Madison, WI | 44.17 | 27 | 38 | 10 | 73 |
| 32 | Albuquerque, NM | 43.43 | 58 | 49 | 23 | 37 |
| 33 | Colorado Springs, CO | 43.36 | 54 | 29 | 52 | 42 |
| 34 | Houston, TX | 43.32 | 19 | 58 | 45 | 86 |
| 35 | Long Beach, CA | 43.20 | 47 | 81 | 32 | 12 |
| 36 | Reno, NV | 43.13 | 46 | 42 | 88 | 27 |
| 37 | Washington, DC | 43.09 | 7 | 96 | 17 | 93 |
| 38 | Chandler, AZ | 42.88 | 80 | 32 | 64 | 14 |
| 39 | Stockton, CA | 42.45 | 86 | 63 | 30 | 10 |
| 40 | Columbus, OH | 42.44 | 57 | 3 | 58 | 61 |
| 41 | Bakersfield, CA | 42.43 | 95 | 12 | 93 | 2 |
| 42 | Glendale, AZ | 42.39 | 62 | 66 | 53 | 11 |
| 43 | Kansas City, MO | 42.15 | 68 | 19 | 56 | 44 |
| 44 | Oklahoma City, OK | 42.02 | 79 | 8 | 81 | 35 |
| 45 | Buffalo, NY | 41.96 | 34 | 15 | 26 | 100 |
| 46 | Miami, FL | 41.73 | 16 | 85 | 61 | 68 |
| 47 | Jacksonville, FL | 41.71 | 32 | 35 | 48 | 67 |
| 48 | Tulsa, OK | 41.69 | 63 | 30 | 78 | 30 |
| 49 | Baton Rouge, LA | 41.67 | 42 | 48 | 50 | 54 |
| 50 | Mesa, AZ | 41.43 | 71 | 40 | 70 | 20 |
| 51 | Virginia Beach, VA | 41.42 | 26 | 34 | 38 | 90 |
| 52 | San Antonio, TX | 41.39 | 28 | 16 | 84 | 74 |
| 53 | Detroit, MI | 41.31 | 70 | 41 | 4 | 60 |
| 54 | Milwaukee, WI | 40.84 | 40 | 23 | 34 | 95 |
| 55 | Birmingham, AL | 40.54 | 75 | 11 | 99 | 59 |
| 56 | Laredo, TX | 40.51 | 99 | 4 | 72 | 31 |
| 57 | Dallas, TX | 40.44 | 30 | 54 | 57 | 72 |
| 58 | St. Paul, MN | 40.38 | 52 | 45 | 29 | 69 |
| 59 | Norfolk, VA | 40.21 | 49 | 68 | 22 | 62 |
| 60 | Irvine, CA | 39.83 | 50 | 90 | 40 | 21 |
| 61 | Cleveland, OH | 39.78 | 37 | 51 | 39 | 83 |
| 62 | Fort Worth, TX | 39.24 | 65 | 72 | 46 | 32 |
| 63 | Anaheim, CA | 39.00 | 55 | 86 | 94 | 6 |
| 64 | Nashville, TN | 38.86 | 29 | 46 | 83 | 88 |
| 65 | Plano, TX | 38.47 | 66 | 70 | 42 | 45 |
| 66 | Chesapeake, VA | 38.44 | 90 | 59 | 21 | 47 |
| 67 | North Las Vegas, NV | 38.37 | 97 | 76 | 49 | 5 |
| 68 | Winston-Salem, NC | 38.22 | 77 | 65 | 71 | 39 |
| 69 | Raleigh, NC | 38.16 | 41 | 52 | 75 | 79 |
| 70 | Charlotte, NC | 37.98 | 39 | 37 | 96 | 71 |
| 71 | Fresno, CA | 37.89 | 94 | 47 | 82 | 19 |
| 72 | Boston, MA | 37.57 | 21 | 98 | 8 | 98 |
| 73 | Lexington-Fayette, KY | 37.50 | 73 | 14 | 86 | 62 |
| 74 | Louisville, KY | 37.42 | 53 | 27 | 89 | 91 |
| 75 | San Bernardino, CA | 37.24 | 100 | 84 | 99 | 8 |
| 76 | Indianapolis, IN | 37.18 | 51 | 18 | 92 | 99 |
| 77 | Arlington, TX | 37.18 | 60 | 75 | 91 | 36 |
| 78 | Lubbock, TX | 37.15 | 81 | 60 | 63 | 48 |
| 79 | Baltimore, MD | 37.10 | 38 | 82 | 14 | 89 |
| 80 | San Jose, CA | 37.05 | 59 | 94 | 43 | 23 |
| 81 | Greensboro, NC | 36.63 | 82 | 55 | 37 | 57 |
| 82 | Memphis, TN | 36.59 | 67 | 7 | 95 | 87 |
| 83 | Wichita, KS | 36.41 | 88 | 10 | 77 | 85 |
| 84 | Aurora, CO | 36.37 | 74 | 33 | 54 | 65 |
| 85 | Anchorage, AK | 36.33 | 56 | 91 | 2 | 82 |
| 86 | Corpus Christi, TX | 36.05 | 69 | 64 | 36 | 66 |
| 87 | Garland, TX | 35.88 | 85 | 77 | 80 | 33 |
| 88 | Riverside, CA | 35.88 | 78 | 87 | 97 | 1 |
| 89 | Fort Wayne, IN | 35.82 | 64 | 21 | 87 | 96 |
| 90 | Durham, NC | 35.47 | 61 | 44 | 85 | 79 |
| 91 | Toledo, OH | 35.46 | 96 | 53 | 51 | 50 |
| 92 | Fremont, CA | 35.44 | 93 | 97 | 20 | 24 |
| 93 | Gilbert, AZ | 35.31 | 91 | 56 | 98 | 14 |
| 94 | Santa Ana, CA | 34.73 | 76 | 93 | 69 | 21 |
| 95 | Oakland, CA | 34.62 | 44 | 95 | 60 | 51 |
| 96 | Jersey City, NJ | 34.20 | 87 | 73 | 59 | 55 |
| 97 | Chula Vista, CA | 33.21 | 98 | 78 | 90 | 29 |
| 98 | Hialeah, FL | 32.96 | 92 | 89 | 68 | 38 |
| 99 | Newark, NJ | 32.33 | 84 | 74 | 28 | 97 |
| 100 | Irving, TX | 31.69 | 89 | 80 | 47 | 76 |
Source: https://wallethub.com/edu/best-worst-cities-for-recreation/5144/


